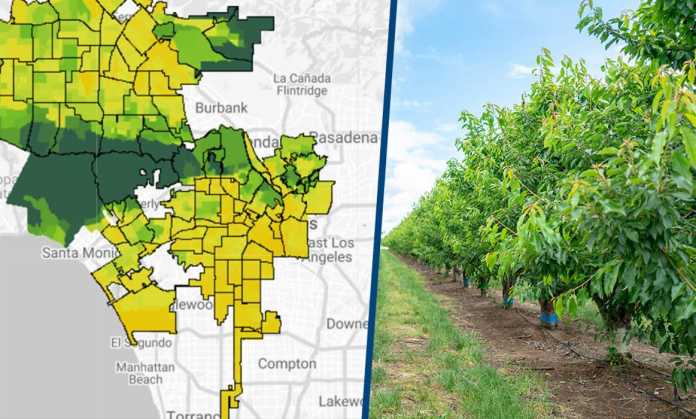
“Tree coverage varies across neighbourhoods and developing an understanding of tree locations can inform and inspire action,” Google said in a blog post. Tree Canopy Lab is a part of Google’s Environmental Insights Explorer platform. The new tool has currently been piloted in Los Angeles and Google said that it plans add data on hundreds more cities. Also Read: Google Uses Recycled Materials: The Tech Giant Goes Green The tool works by collecting the imagery from the sky, especially during the spring, summer and fall seasons, and also encompasses an overlay of imported public data from external sources, including heat risk data, population density data, land use data, and neighbourhood boundary data. In order to estimate tree canopy coverage, the tech giant then analyses the imagery with 3D digital surface models to create a vegetation probability model. Any values recorded above a certain threshold are classified as a tree canopy and using estimates generated by the model, overall coverage for each area is determined. The tool puts the data collated via aerial imagery on a map with population of neighbourhood areas along with their vulnerability to high temperatures. Viewers can learn about the tree coverage, average heat health index and average population density per area simply by clicking on an area on the map. Users can also learn how heat and population density draw a parallel with tree coverage and land type distribution across neighbourhoods. Read: Google Experimental AI Tool To Convert Webpages Into Videos The aim is to plant trees in areas that are more exposed to high temperatures and help cities reduce carbon emissions and improve air quality. It also aims that planting new trees in these areas could help cities adapt to a warming world and save lives during heat waves. Google also posted a form for city planners to reach out to them in case individuals are interested to use the tool in the future


